Introduction
I bought 2 small DPFs with the intention to display Grafana graphs. This is the same DPF that PC modders use. It was meant to be stuffed inside a PC case (behind the transparent glass side panel) to display PC stats (CPU, Memory, Disk) using a program provided by the manufacturer or something like Aida64.
Both of the software was meant to be used under windows, but I want both of them to work under Linux. This also means that devices like the Raspberry Pi and OpenWRT routers can make use of the display.
Python was the language I wrote both scripts in mostly because of PIL. This means it will work for a pi but is likely too heavy for the standard OpenWRT router.
Kipye LCD
 |
 |
|---|---|
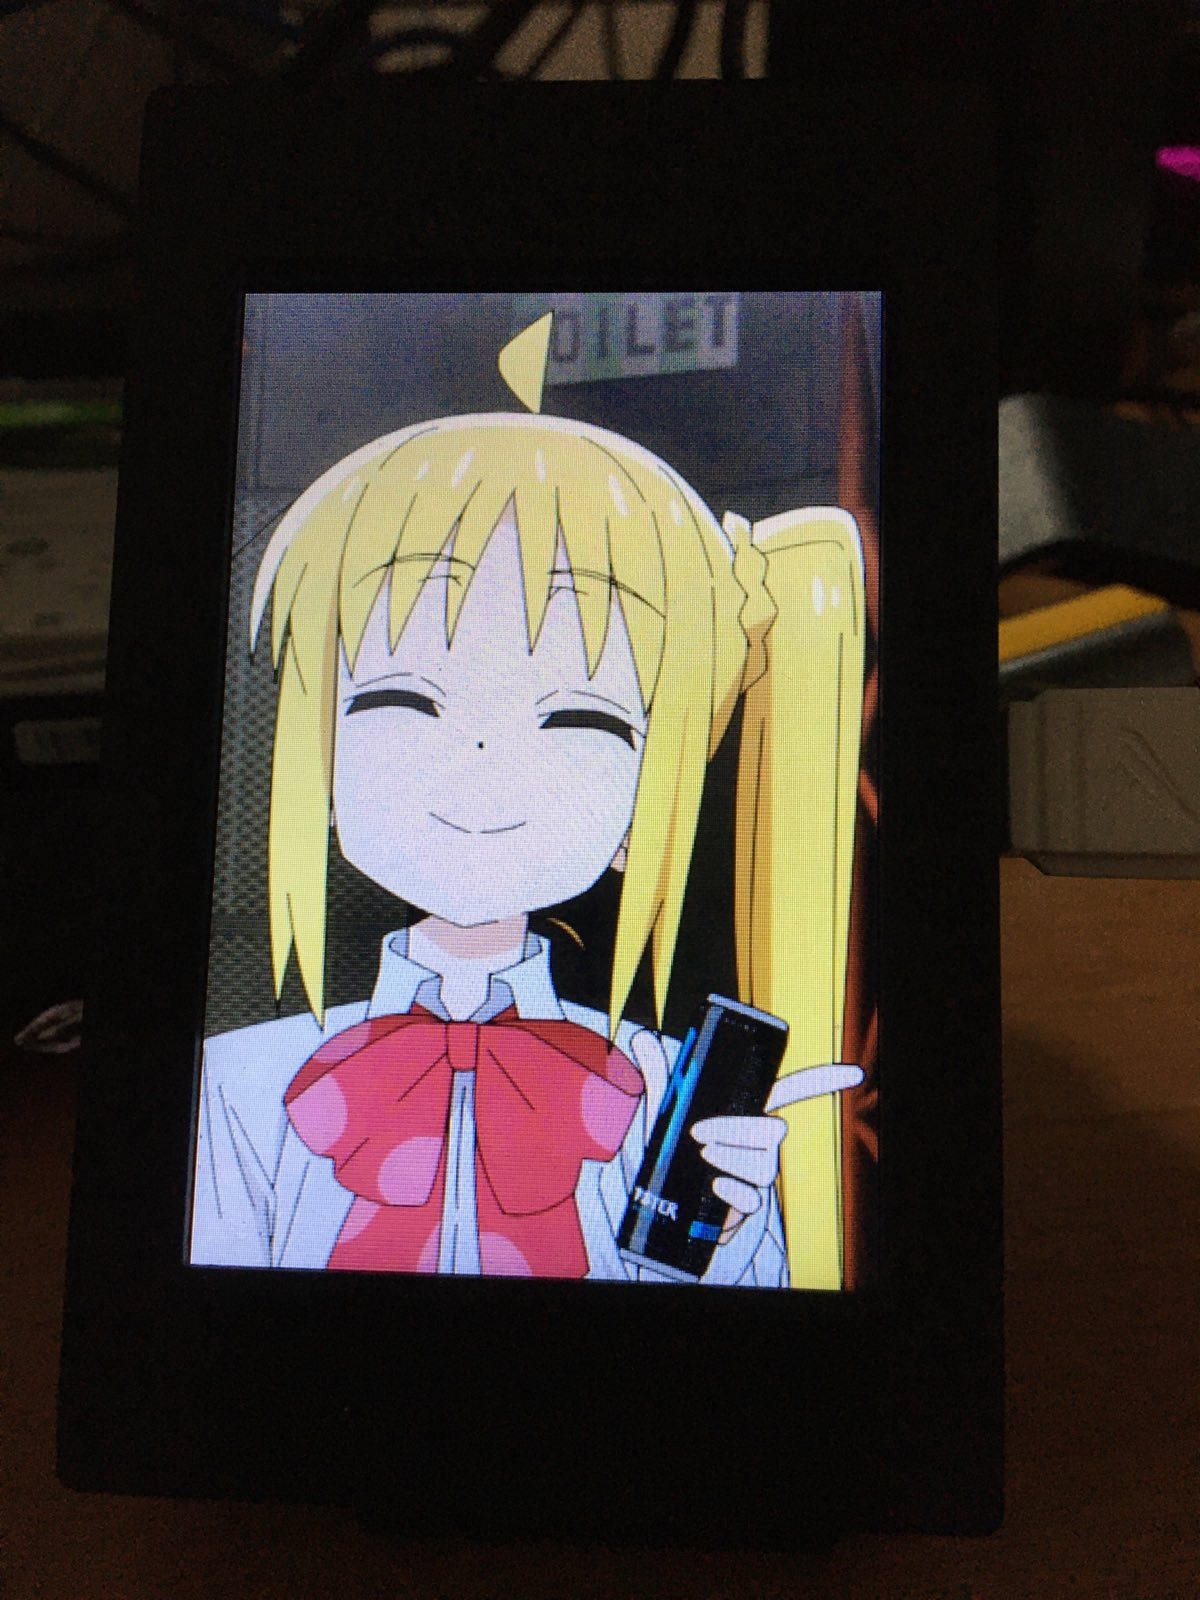
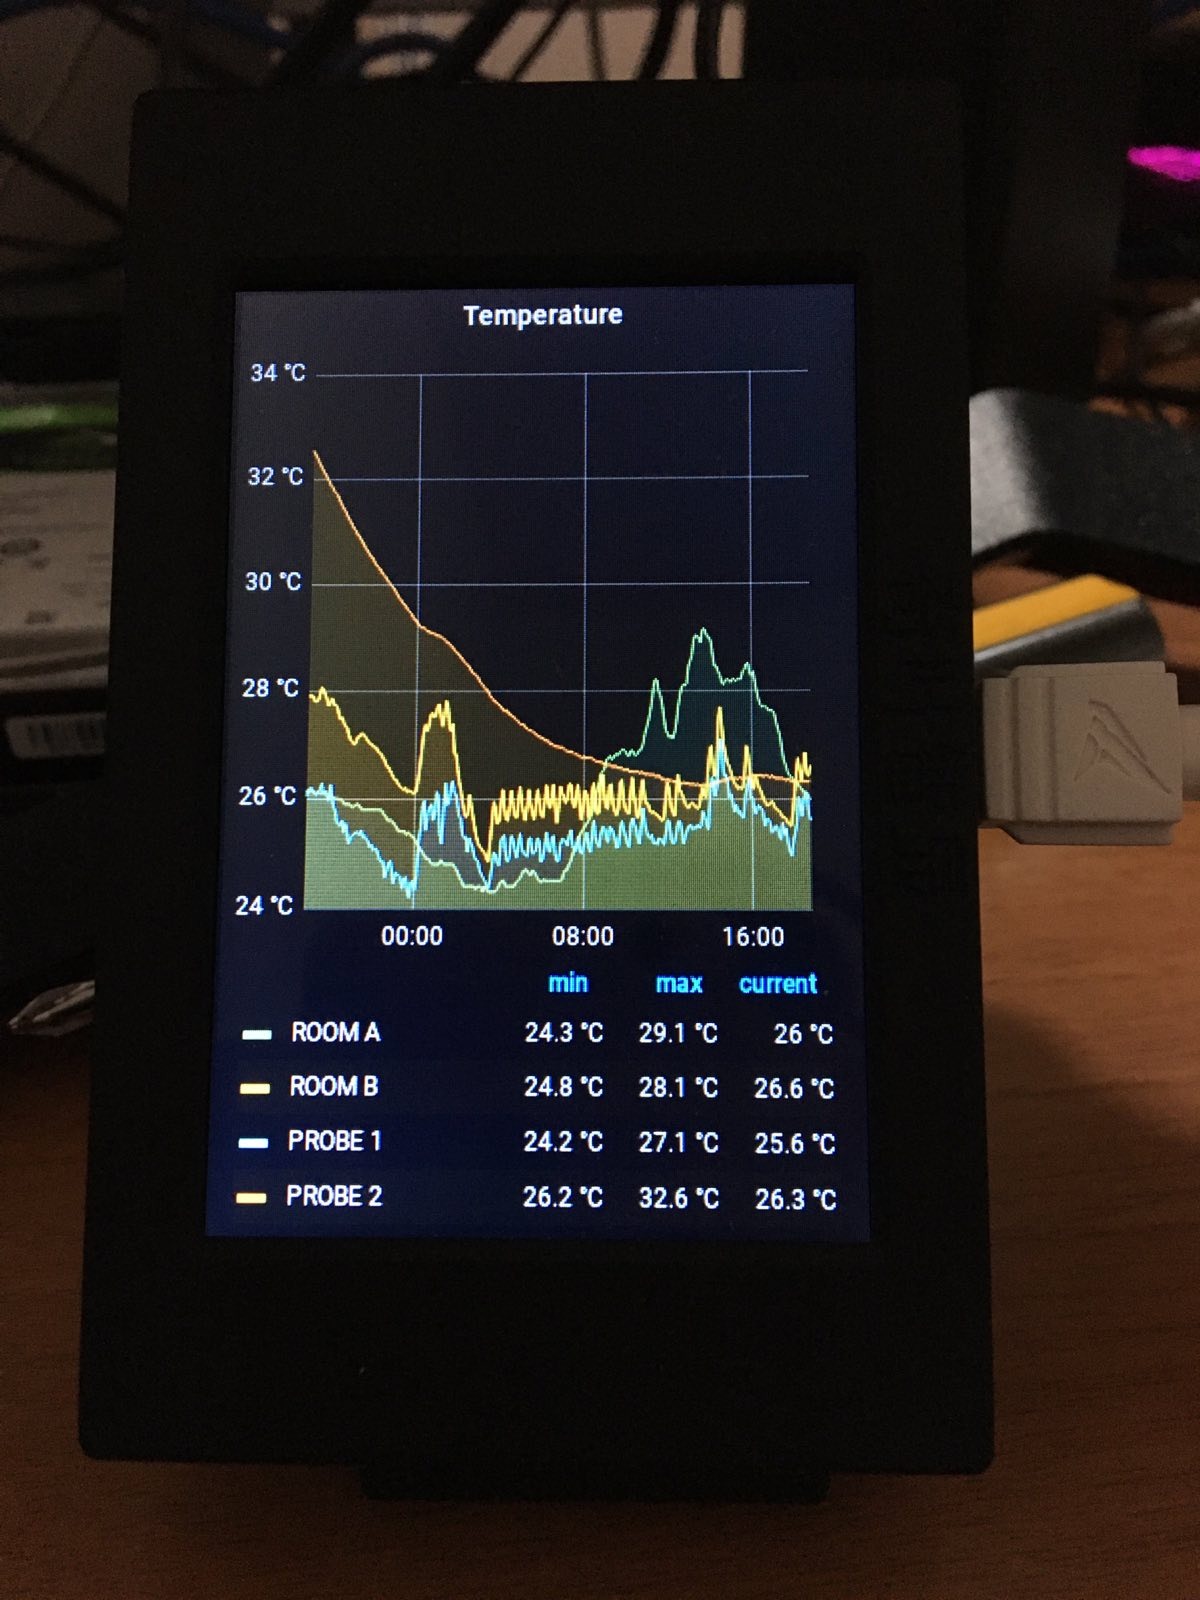
| Sample Image | Loading a rendered image from Grafana |
This was the first USB LCD DPF I bought from Lazada and while the product description contains the keyword “Aida64”, this screen is not actually compatible with Aida64 and comes with its own program from the manufacturer.
The program as not included in the disk and was obtained from someone doing a review giving the link.
The program itself appears to have been made with C# and uses serial over USB to talk to the screen. I de-compiled the program to see how it communicates with the screen.
 1def get_color16(rgb_arr):
 2    """
 3    conversion code lifted from the manufacturer
 4    alpha is discarded if present
 5    """
 6    R = rgb_arr[0]
 7    G = rgb_arr[1]
 8    B = rgb_arr[2]
 9    num = 0
10    num2 = 0
11
12    num = (num | (R >> 3))
13    num2 = (num2 | (num << 11))
14
15    num = 0
16    num = (num | (G >> 2))
17    num2 = (num2 | (num << 5))
18
19    num = 0
20    num = (num | (B >> 3))
21    num2 = (num2 | num)
22
23    return num2
It uses RGB values that have been cut-off and shifted via binary operations. I then made a python program that does the same thing. Since this was meant to be used with scripts, the image data is fed into stdin of the script.
Application
Currently, I just use this screen attached to a raspberry pi. It calls Grafana to render an image every 5 minutes, then pipes the image to Python to write to the screen.
1$ curl -k -l -s "https://www/link-to-image" | python main.py --stdin
Kipye LCD Code Repo
The code is hosted at https://github.com/amyeo/kipye-lcd
AX206 LCD
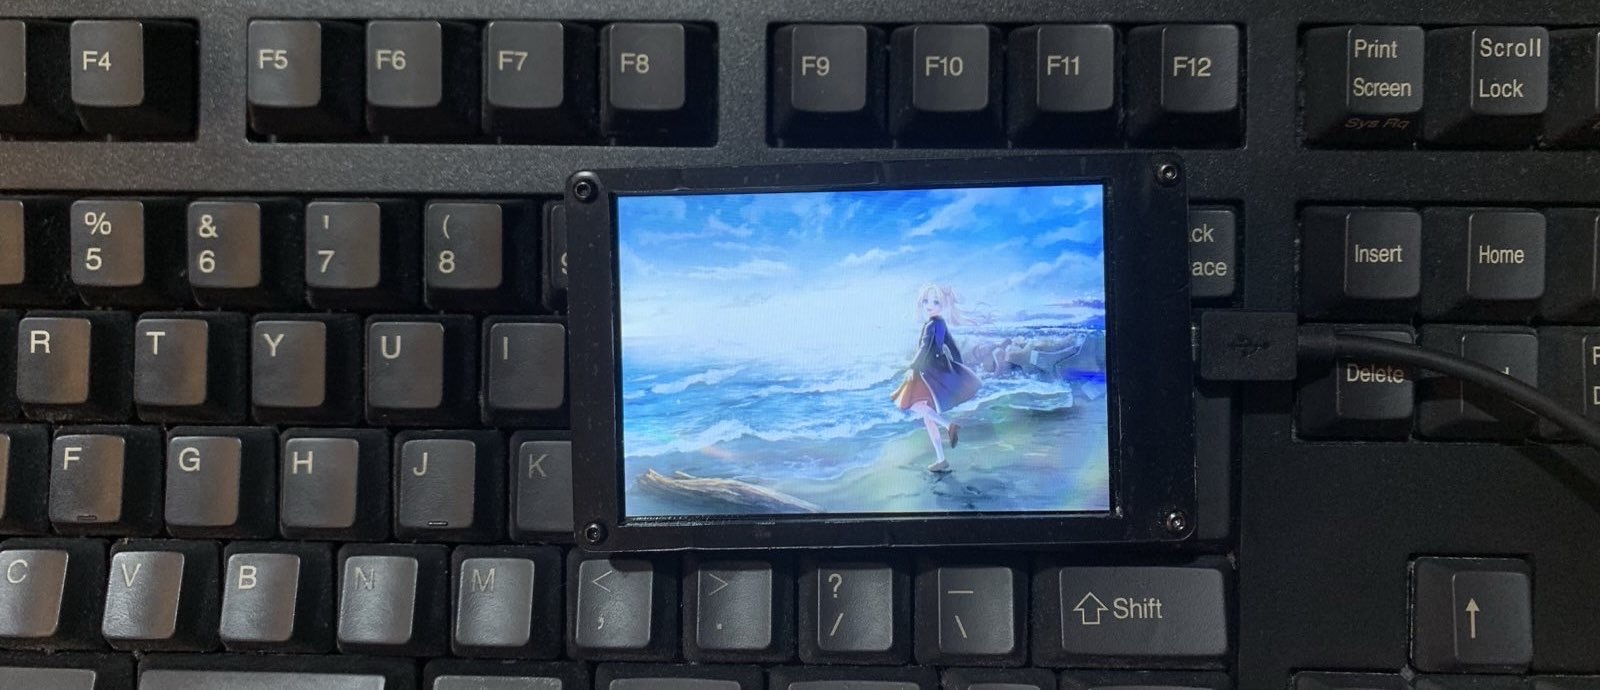 (AX206 displaying 480x320 test image)
This LCD I ordered second after testing the first one out. Stocks were different at this time and what was available was this LCD. This one actually worked with Aida64.
The main difference of this screen is that it uses raw USB commands to talk to the device (libusb). I have noticed that this has resulted in less errors (picture corruption in particular) and higher update speed “frame rate”. While writing constantly to it, I was able to get between 1-2 FPS.
This one had examples already for Linux. I had the expectation that it was just plug and play to display images, but I was wrong since the golang and Python programs I had found for it were reliant on an old version of libusb. I found the ax206 source code and used that to create a Python script that worked like the one for the Kipye LCD.
The pixel format is the exact same so I was able to use the exact same get_color16(rgb_arr) function.
Get Dimensions
The screen itself can be queried to get its dimensions.
 1def get_dimensions(handle):
 2    write_barray(handle, [
 3        0x55, 0x53, 0x42, 0x43, 0xde, 0xad, 0xbe, 0xef,
 4        0x5, (0x5 >> 8), (0x5 >> 16), (0x5 >> 24), 0x00, 0x00, 0x10,
 5        0xcd, 0, 0, 0, 0, 2, 0, 0, 0, 0, 0, 0, 0, 0, 0, 0
 6    ])
 7
 8    a = handle.bulkRead(0x81, 5)
 9    logging.debug(f"Get dimensions raw return: {a}")
10    width = a[0] | (a[1] << 8)
11    height = a[2] | (a[3] << 8)
12    logging.info("Width: {width}")
13    logging.info("Height: {height}")
14    do_ack(handle)
15    return width, height
Blit/Write to screen
To blit, the screen uses its own co-ordinate system. In the case of 480 x320:
(0,0) refers to the upper-left most pixel. To blit to the screen, you would need to tell the screen first what area you intent to write to. The target area is a rectangle (defined by 4 points: r0-r3) within the bounds covered by the screen dimensions.
I can see potential for this to be used to draw separate images within one screen. (its likely more useful for bigger screens)
 1def init_blit(handle, r0, r1, r2, r3):
 2    block_len = (r2-r0)*(r3-r1) * 2
 3    logging.info("Block LEN; {block_len}")
 4    block1 = (block_len & (0xFF-1))
 5    block2 = (block_len & (0x10000-1)) >> 8
 6    block3 = (block_len & (0x1000000-1)) >> 16
 7    block4 = (block_len & (0x100000000-1)) >> 24
 8    write_barray(handle, [
 9        0x55, 0x53, 0x42, 0x43, 0xde, 0xad, 0xbe, 0xef,
10        block1, block2, block3, block4, 0x00, 0x00, 0x10,
11        0xcd, 0, 0, 0, 0, 6, 0x12,
12        (r0 & (0xFF)), ((r0 & (0x10000-1)) >> 8), (r1 & (0xFF)), (r1 & (0x10000-1) >> 8),
13        ((r2-1) & (0xFF)), (((r2-1) & (0x10000-1)) >> 8), ((r3-1) & (0xFF)), (((r3-1) & (0x10000-1)) >> 8), 0
14    ])
Next step is to tell the screen how many pixels it should expect, and the points that make up the rectangle to draw to (r0,r1,r2,r3).
 1def draw_pil_image(handle, pil_im_obj, r0, r1, r2, r3):
 2    init_blit(handle, r0, r1, r2, r3)
 3    assert type(pil_im_obj) == Image.Image
 4    my_bytes_2 = bytearray()
 5    im1 = Image.Image.getdata(pil_im_obj)
 6    for x in im1:
 7        h565 = get_color16([x[0], x[1], x[2]])
 8        b1 = (int(h565 & 0xFF))
 9        b2 = (int((h565 & 0xFF00)) >> 8)
10        logging.debug(f"Blit {h565} TO -> {b1}, {b2}")
11        my_bytes_2.append(b2)
12        my_bytes_2.append(b1)
13
14    logging.info(f"Blit buffer len: {len(my_bytes_2)}")
15    sent_bytes = handle.bulkWrite(0x01, my_bytes_2, timeout=5000)
16    logging.info(f"Blit sent bytes: {sent_bytes}")
17    do_ack(handle)
Each pixel consists of two bytes. The get_color16(rgb_arr) function from earlier is used to split it from RGB (discard alpha if PNG).
Once they byte array has been assembled, it is then sent to the screen.
AX206 Code Repo
Code repo is hosted at https://github.com/amyeo/ax206-lcd